Guide17th November 2025

This is part 2 in a series of articles about content impact and value. In the first part of the series – Content measurement: translating impact for business leaders – we looked at why content pros need to translate content impact into language that leaders actually care about, and why vanity metrics fail to demonstrate the value of our work to leadership. We established that connecting content to business outcomes requires meaningful KPIs – not just any numbers, but the right numbers.
But here’s where many content folks get stuck: knowing which KPIs actually matter for your situation, and how to track them. I’ve been in so many workshops where teams have felt blocked when it comes to defining KPIs and where the conversation drifted back to the same old comfortable vanity metrics.
The challenge isn’t understanding what a KPI is in theory. It’s about pinning down which numbers will prove to leadership that content is contributing to organisational goals in practice. It’s the rigour of asking ‘and why does that matter?’ over and over again until you get to the meaningful data points. It’s building a measurement framework that’s realistic for your context – one that you can actually implement and sustain, not an aspirational-but-unused spreadsheet.
This guide will give you a practical process for identifying your KPIs and building a measurement framework. We’ll look at:
- The strategic goal your content supports
- Your content strategy for reaching that goal
- The objective that shows your strategy is working
- The KPI that proves you’re moving toward the goal
- The metrics that help you optimise
- Where you’ll get the data from
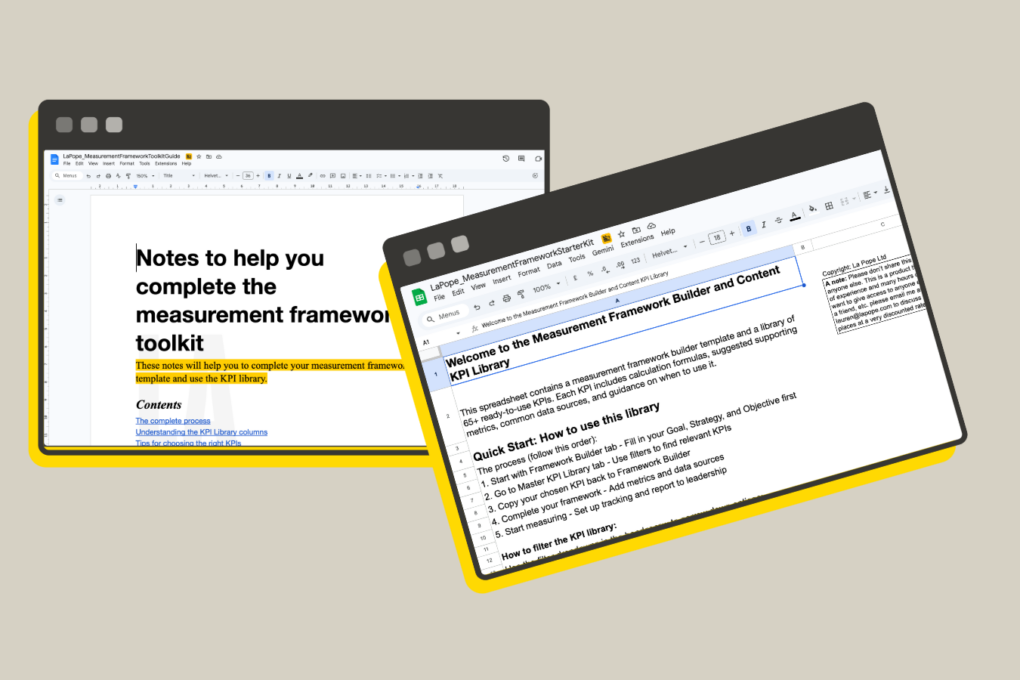
Want a head start?
The language of strategic measurement
It’s all too easy to get muddled by the language surrounding strategic measurement. So let’s start by getting clear on the terminology we’re going to be using:
- Goal: The end state you’re trying to reach
- Strategy: Your chosen approach to reach that goal
- Objective: Specific, measurable milestone that shows strategy is working
- Tactics: The actual activities and tasks you do
- KPI: The number that shows whether your strategy is moving you toward your goal
- Metric: Any number you can measure (most are just interesting, not important)
Imagine you love tomatoes, you eat a lot of them, and your preference for the finest, ripest heirloom varieties is getting expensive. So you decide it’s time to start cutting your tomato expenditure. In this scenario:
- Goal: Save £150 on tomato purchases over the summer (June-September)
- Strategy: Grow your own tomatoes instead of buying them (you considered another strategy – buying cheap tomatoes – but rejected this approach as the idea of wooly, underripe tomatoes compromises your core values and make you sad)
- Objective: Harvest 60kg of tomatoes over the season (enough to replace all purchases)
- Tactics: Grow 6 plants in raised beds, plant in May, water daily, feed weekly with tomato food, stake plants, pinch out side shoots (you chose these after reading up on tomato growing, and taking your garden and the kind of tomato you want to grow into consideration)
- KPI: £ saved (cost you would have spent buying tomatoes minus cost of growing them – seeds, compost, feed)
- Metric: Kilograms of tomatoes harvested, number of flowers, plant height, hours spent gardening, tomato deliciousness rating, smugness levels
There are two big takeaways from all this talk of terminology and tomatoes:
- Before you can come up with a measurement framework, you need clarity on: the goal(s) your content is supporting – think about the things your leaders are focused on; your content strategy – the choices you’re making about how you will reach the goal; the objective – something tangible that shows your strategy is working and getting results.
- The KPI is what really matters to your leaders – this is what will show your leadership what you’re doing to contribute to strategic goals. But the KPI has to be meaningful and considered. Kilograms of tomatoes harvested is fine as a metric, but it’s a terrible KPI because it doesn’t connect back to the goal.
Metrics and KPIs: a two-tiered approach to measurement
While KPIs might be the thing you need to show impact to leaders, metrics still have a place in your measurement framework. As a content team, metrics like engagement rates, scroll depth, time on page, clicks, and more can help you to optimise and iterate.
It can help to think about it as two-tiers of measurement:
- Metrics: dashboard-based, always-on, reviewed daily/weekly (‘in-flight’ data), just for the content team
- KPIs: report-based, calculated periodically, reviewed quarterly/annually, for the content team, leaders and stakeholders
Understanding your measurement context
Another thing to get clear on before you work on KPIs is the context you’re working in. There are 3 things to look at: the type of organisation, what kind of content team you are, and your level of capability when it comes to measurement.
1. Type of organisation
What value and impact mean is shaped by the kind of organisation you work for:
- In a product context, content is there to support the product, so value is things like user success, retention, or reduced support costs.
- In a nonprofit/charity context, content is there to deliver on your mission and charitable aims, so value might look like getting people to use services, changing behaviour, or donations.
- In a media/publishing context, content is the product, so value looks like audience growth, engagement, or subscriptions.
2. Type of content team
Your content team’s position in your organisation affects what you can/should measure:
- If you’re a reactive/service team, because you’re responding to briefs/tickets, you have limited influence on decision-making, so it might make sense to focus your measurement framework on things in your control, like efficiency and cost savings.
- If you’re a strategic contributor, you have some influence, so you need to make sure you can connect content success to broader objectives through your KPIs.
- If you’re a revenue/mission driver, you need to be looking for ways to show a direct connection between content and business/organisational impact.
3. Level of measurement capability
You need to be realistic about where you’re starting from and the level of measurement capability in your team and the organisation as a whole.
Early stage
This is you if:
- Your organisation has no clear strategy or KPIs (or if they exist, nobody can articulate them)
- Your content team doesn’t currently measure anything beyond basic vanity metrics like page views, engagement rates or downloads
- You don’t have access to proper analytics tools, or nobody knows how to use them
- There’s no established process for tracking or reporting on content
What’s realistic at this stage:
- Focus on simple, observable metrics that you can track with basic tools
- Prioritise cost savings and efficiency gains (these are easier to demonstrate without sophisticated measurement)
- Start with one metric that you can track manually if needed
- Don’t try to build a comprehensive framework yet
Developing
This is you if:
- Your organisation has some strategic direction, even if it’s not clearly documented
- Your content team looks at a few metrics (page views, engagement rates) but they’re not connected to organisational outcomes
- You have access to analytics tools (GA4, email platforms) but aren’t using them strategically
- Other teams (marketing, product, sales) have some KPIs but content isn’t part of that conversation
What’s realistic at this stage:
- Map content’s contribution to existing organisational priorities
- Connect your current metrics to outcomes
- Start tracking 1-2 KPIs that link directly to what leadership cares about
- You might not have perfect data yet, but you can make a reasonable case
Established
This is you if:
- Your organisation has clear strategy and KPIs that other teams work toward
- Your content team has some emerging KPIs, but they need refining
- You have good access to data and tools, and know how to use them
- Content is part of strategic conversations, but needs to prove value more consistently
What’s realistic at this stage:
- Integrate content KPIs into the organisation’s existing measurement framework
- Focus on demonstrating ROI and business impact more rigorously
- Track 2-3 KPIs with confidence and regular reporting
- Segment your analysis to show what content works best and why
A step-by-step process for identifying your KPIs
This process will help you to identify some meaningful KPIs to start reporting on. I’ve included an example alongside the steps to show you how it works in practice.
The example: Ali is a content lead at a mental health charity. The charity provides counselling services and runs awareness campaigns. Ali and their team are at the ‘developing’ capability stage – the organisation has some strategic direction but content isn’t formally measured. Ali currently tracks page views and social media engagement, but their director keeps asking ‘what difference is content making?’
1. Identify the goal
What you’re looking for: The strategic-level goal. This could be at the organisational level, or at a product/campaign level.
How to find it:
- Ask your manager: ‘What are the top 3 things you’re measured on?’
- Check annual reports, strategic plans, board presentations
- Ask: ‘What keeps you up at night?’ or ‘What would make you look good to the CEO/board?’
Common roadblocks:
- If there’s no clear strategy: Look at what actually happens – where does money come from? What does the CEO talk about most?
- If everything is a priority: Ask ‘If we could only focus on one thing this quarter, what would it be?
Example: Ali books 20 minutes with their director and asks: ‘What are the main things the board is focusing on this year?’ They learn that the board wants to increase individual donors from 2,000 to 3,500 over 2 years to diversify income.
Note: You might have multiple strategic policies, objectives and KPIs for a single organisational goal.
2. Identify the strategy
What you’re looking for: Your chosen approach to reach that goal. The element of your content strategy that ladders up to the goal.
How to work it out:
- What’s the path from ‘never heard of us’ to ‘does the thing we want’?
- Where does content appear in that journey?
- What content do you actually control?
- Where does content have the most influence?
Example: The element of the content strategy that ladders up to the goal is building relationships with supporters through the email newsletter programme to convert them from ‘interested’ to ‘donating’. Ali’s thought process behind this is:
- For someone to become a donor they need to: know we exist, understand what we do, care, trust us, take action
- The fundraising team owns donation pages and phone campaigns
- The content team creates: blog posts, website content, email newsletters, impact reports
- Content’s biggest role is nurturing people from ‘interested’ to ‘ready to donate’
3. Identify the objective
What you’re looking for: A specific, measurable milestone that shows your strategy is working.
How to work it out:
- If content achieves this, would it meaningfully contribute to the goal?
- Is this realistic given your resources?
- Can you measure whether it’s working?
Example: Ali sets the following objective: Move 500 newsletter subscribers from ‘engaged reader’ to ‘first-time donor’ over 12 months. Their thought process is:
- 500 new donors would be 33% of the 1,500 growth needed, which is a meaningful contribution
- The team has capacity to send 2 newsletters per month. At the moment, the list is about 8,000 people. 500 people is 6.25% of the list. This feels ambitious but not unrealistic, especially if they grow the email list.
- It’s within their current capabilities to track newsletter engagement, click-throughs and conversion.
4. Identify the KPI (and the data sources)
What you’re looking for: The number that shows whether your strategy is moving you toward your goal. You should also check whether you can actually access the data you need to calculate the KPI.
How to identify it:
- List possible KPIs based on your objective
- Apply the ‘so what?’ test: If this number goes up, does it prove my strategy is working?
- Check if you can actually measure it and where the data live
Example: Ali decides to choose this as their KPI: Number of first-time donations from newsletter subscribers per quarter. Their thought process was that this is the best possible KPI because:
- First-time donations from newsletter subscribers is directly connected to the goal and objective
- Going with the number of donations rather than a conversion rate is more in keeping with the goal
- Adding UTM tracking to newsletter links means that can see which new donations came from email, if they request that the fundraising team adds this to their quarterly report
5. Identify the metrics
What you’re looking for: Data points you can measure that will help you optimise and iterate your content. Again, check if you can access the data.
How to identify them:
- Look at your content tactics – what numbers would tell you if they’re working well?
- Check what data your tools already provide (GA4, email platform, social media)
- Ask: ‘What would help me make this content better?’ not ‘What proves our strategy works?’
- For each KPI and metric, ask: ‘Where does this data live?’
- Identify data you’ll need from other teams (sales, fundraising, customer service, product)
- Flag what doesn’t exist yet and needs to be set up (tracking codes, integrations, manual processes)
- Pick 3-5 metrics maximum – enough to optimise, not so many you’re drowning in data
Example: For this, Ali chooses the following metrics and data sources:
- Email open rate (email software)
- Click-through rate on donation CTAs (email software)
- Number of engaged subscribers (open 50%+ of emails) (email software)
- Newsletter content type performance (which stories drive most engagement) (email software)
6. Plan how you’ll report to leadership
What you’re looking for: A simple, clear way to show leadership how content contributes to business goals.
How to approach it:
- Lead with the business outcome, not the content activity
- Connect your KPI to their priority in 2-3 clear steps
- Spell out the value in cash terms if you can
- Choose a reporting format that matches your organisational culture: a one-pager or short and simple presentation often works well
The connection. Use this simple structure to explain your KPI: What content does → What that achieves → What that means for the organisation
Example: Ali breaks down the KPI and contextualises it like this:
- Email newsletter educates supporters and includes donation CTAs →
- Those CTAs convert engaged subscribers into first-time donors (target: 125 per quarter) →
- This would contribute 500 new donors annually, or 33% of growth target →
- Which supports the board priority: diversify funding by growing individual donor base
- 500 new donors × £45 average donation = £22,500 in year 1
- If 30% become recurring donors, significant ongoing value in years 2-3
- They decide to create a simple quarterly one-pager showing:
- Number of first-time donations from newsletter (current quarter vs target)
- Year-to-date progress toward 500
- Brief note on what they’re testing to improve results
KPIs for different types of goals
The step-by-step process we’ve just looked at focuses on a straightforward, conversion-based goal. But what about when things get more complicated? Let’s take a look at 4 common scenarios that require different approaches to measurement.
1. Cost reduction
These are KPIs that show money saved or costs avoided through content.
You might want to consider cost reduction based KPIs if:
- Your organisation is focused on efficiency and reducing operational costs
- You’re a reactive or service-based team with limited strategic influence
- Leadership cares most about ‘doing more with less’
Example cost reduction KPIs
| KPI | Description | Example |
| Help content deflection rate | % of users who solve problems via help content instead of contacting support | 1,000 deflected tickets × £15 = £15,000 saved per month |
| Content reuse efficiency | Time saved through content component reuse | Modular content saved 200 hours x £50 per hour this quarter = £10,000 saved |
| In-house vs agency cost comparison | Cost per content asset produced internally vs externally | Blog posts cost £500 via agency vs £150 in-house = 70% cost reduction |
2. Risk mitigation and preventative work
These are KPIs that show how content has prevented problems, reduced risks, or maintained compliance.
These kinds of KPIs might be of interest if:
- You work in a regulated industry (healthcare, finance, government)
- Content governance and compliance are critical
- Your work prevents problems rather than creating visible wins
- Leadership cares about reputation, legal compliance, accessibility
Example risk mitigation KPIs
| KPI | Description | Example |
| Compliance rate | % of content that meets regulatory/accessibility standards | 99.5% of content now meets WCAG 2.1 AA standards, reducing risk of accessibility complaints (average cost £8k each) |
| Content errors prevented | Number of near-misses caught before publication | Content review process caught 24 potential compliance issues this year |
| Consistency metrics | Reduction in customer confusion/support tickets about unclear information | Since implementing content standards, support tickets about [unclear policy] dropped 35% |
3. Foundational work and operational improvement
These are KPIs that show process improvements, time savings, or increases in speed.
These kinds of KPIs might be of interest if:
- You’re building content systems, governance, operations, or taxonomy
- You’re focusing on work that delivers long-term value but has no immediate outputs
- Leadership questions why you’re not ‘producing content’
- Your work enables efficiency but doesn’t create visible products
Example foundation work KPIs
| KPI | Description | Example |
| Time-to-publish reduction | How much faster can content get published? | Streamlined approval process reduced time-to-publish from 6 weeks to 2 weeks, enabling faster response to opportunities |
| Content velocity | More content published with same resources | Publishing 30% more content per month without additional headcount |
| Bottleneck elimination | Reduction in review cycles or approval stages | Removing one approval stage saved 120 hours this quarter = £6,000 |
4. Brand awareness
These are KPIs that show meaningful audience growth and engagement, not just vanity metrics.
These kinds of KPIs might be of interest if:
- You’re building awareness in a new market or category
- The path from awareness to conversion is long (6+ months)
- You don’t control conversion touchpoints (sales team, events, phone centre)
- Leadership cares about market presence and brand recognition
Example brand awareness KPIs
| KPI | Description | Example |
| Qualified audience growth | Growth in your specific target audience | Email list of [audience segment] in [sector] grew from 2,000 to 5,000 |
| Share of voice | Your brand mentions vs competitors in your category | Increased from 15% to 25% share of voice in [category] conversations |
| Engagement quality | Not just likes, but meaningful interactions | 20% of newsletter subscribers forward to colleagues |
Putting this into practice
I feel like I could/should/do end everything I write with this warning: content transformation takes time, and adopting a truly strategic approach to your measurement isn’t going to happen fast.
Start small with some foundational work:
- Understand your context: Get clear on your organisation type, measurement maturity, team position
- Identify a single KPI: Start with a goal, work backwards to content, and choose what you can actually track
- Start measuring and reporting: Start measuring that KPI and pilot a simple reporting format. An imperfect measurement framework that you use beats a perfect one that you never implement.
And remember that your content isn’t necessarily failing if you don’t see incredible numbers from the start. Foundational work shows value in months or even years, not weeks. And good content compounds in value over time.